
Last week the U.S. economy lost 23,000 jobs and the S&P 500 closed at a record 7,757.64. Every commentator called that a contradiction. It isn’t one — it’s the clearest signal you’ll get all year that the K-shaped economy has quietly rewired what actually drives American growth.
The market didn’t ignore the jobs report. It read it correctly and concluded that payrolls no longer matter as much as they used to. That sounds cynical. The data says it’s arithmetic.
The economy stopped running on paychecks
Moody’s Analytics chief economist Mark Zandi has been tracking this for two years, and his latest estimate is the one worth memorising: the top 20% of American households — those earning above $175,000 — now account for roughly 60% of all consumer spending. In the run-up to the dot-com bubble, that same group accounted for about 50%. The top 10% alone drove nearly half of all consumer outlays in 2025, the highest share ever recorded.
Now look at the growth rates, because that’s where the story sharpens. Over the past year, spending by the top 20% rose 6.5%. Spending by the bottom 80% rose 2.6% — below the roughly 3.1% core PCE inflation rate. One group is expanding its real consumption. The other is quietly shrinking it.
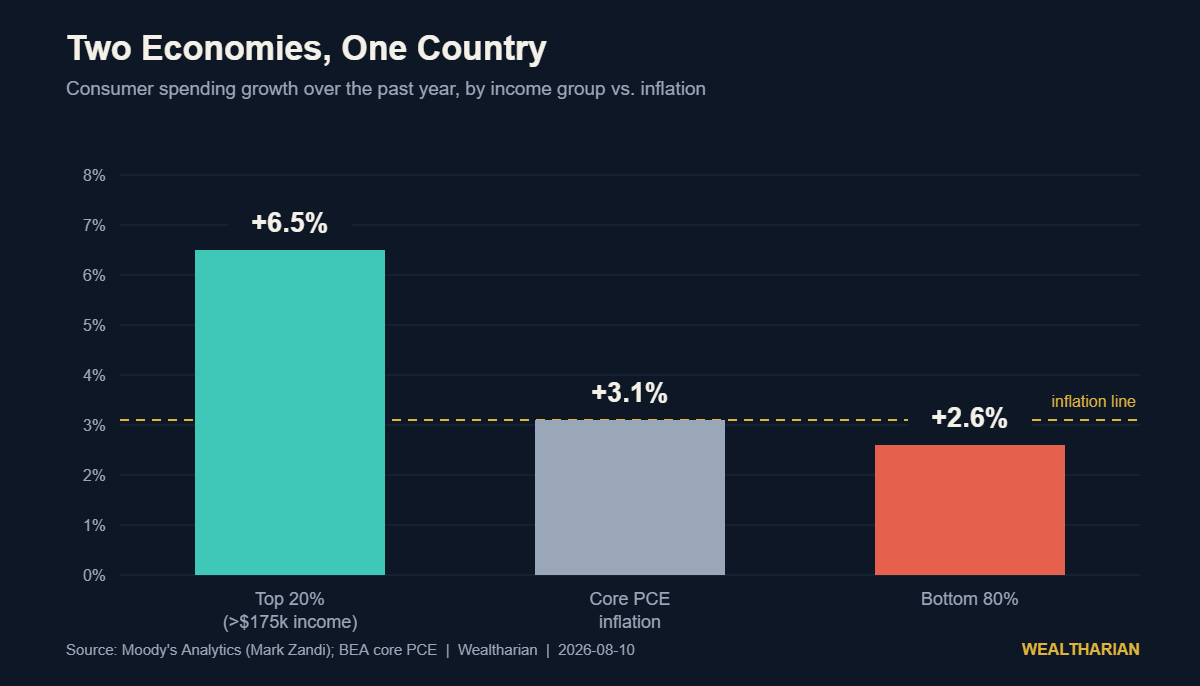
Consumer spending is roughly two-thirds of U.S. GDP. If 60% of that two-thirds comes from a cohort whose spending is accelerating, then a negative payroll print in the wage economy simply doesn’t hit the growth number the way your textbook says it should. The marginal American consumer is no longer a worker deciding whether overtime covers the car payment. The marginal American consumer is a shareholder watching a portfolio balance.
The contrarian part: this makes the market more fragile, not less
Here’s where almost everyone stops, and where the actual insight starts.
The standard reaction to the K-shaped economy is moral: it’s unfair, it’s hollowing out the middle, someone should fix it. All defensible. None of it changes your balance sheet by a single dollar. The more useful observation is structural — and it cuts against the bulls.
Nearly 90% of U.S. corporate equities are held by the top 20% of the wealth distribution. The top 1% alone holds about half of all equities; the bottom 90% holds roughly 13% — less than the top 1% owns by itself.
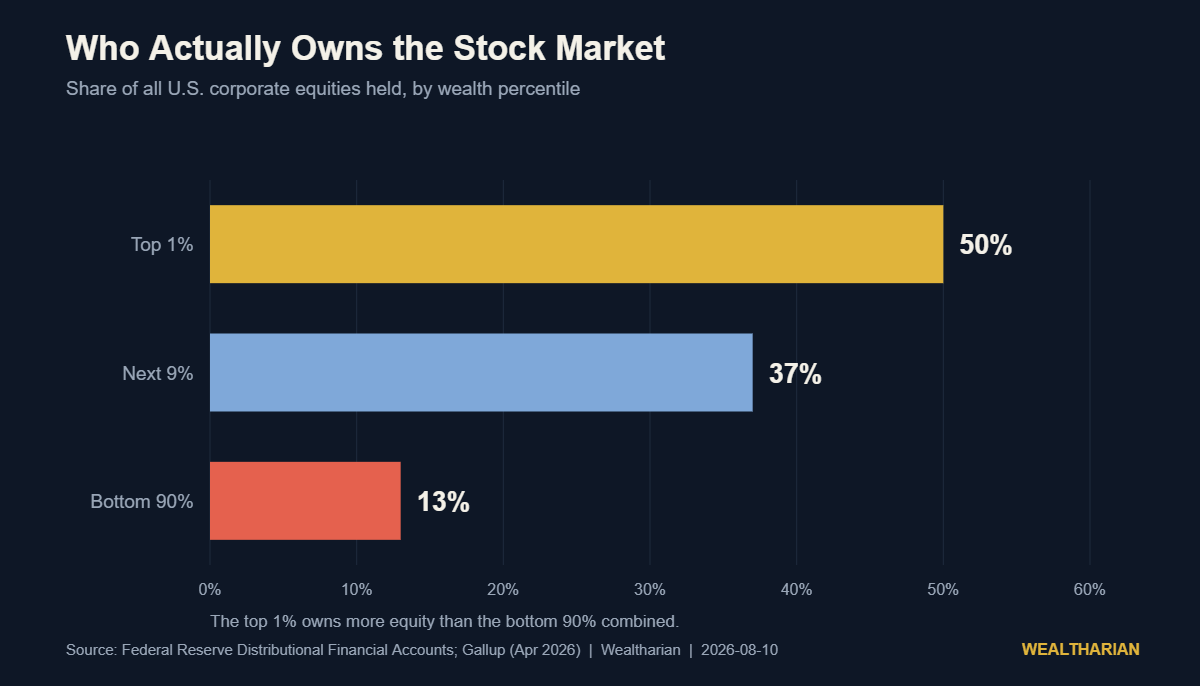
Put the two facts together. The group that supplies 60% of consumer spending derives the bulk of its marginal wealth from equities. That makes the stock market a load-bearing wall of the American economy, not a scoreboard hanging on it.
Which means a serious drawdown is no longer just a portfolio event. In a 1995 economy, a 20% correction hurt investors and left the wage-driven spending engine running. In a 2026 economy, a 20% correction takes the wind out of the cohort that is the spending engine — and the wage economy underneath is in no shape to catch it. Real average hourly earnings were down 0.1% year-over-year in June. The personal savings rate sat at 2.7%, its lowest since the month Bear Stearns collapsed. There is no buffer down there.
So the record high isn’t evidence of a healthy economy. It’s evidence of a reflexive one, where asset prices and consumption now prop each other up. That works beautifully in both directions — which is precisely the problem. Zandi’s own framing is blunt: high-income households are the “last pillars,” and a market downturn would knock the wind out of them.
Why the Fed put isn’t what you think it is
There’s a second-order consequence worth sitting with. If the wealth effect is now the transmission mechanism for growth, then the Federal Reserve’s reaction function has quietly changed too. Historically, the Fed eased when employment cracked. But in an economy where employment cracking barely dents aggregate demand — and where asset prices cracking would devastate it — the thing the Fed can least afford to let break is the market itself.
That is not a bullish argument for buying every dip. It’s a warning that policy is now entangled with asset prices in a way that makes both more volatile, not less. We wrote about the danger of building a plan around Fed timing in Rate Cuts Were Never a Wealth Plan, and that logic holds double here.
What this actually means for your money
Strip out the commentary and four practical conclusions fall out.
1. Wage income is now the fragile leg, not the safe one. Most people build a financial plan treating salary as the stable base and investments as the risky extra. The data has inverted that. Payrolls went negative; real wages went slightly negative; the assets did the compounding. If 100% of your income comes from wages, you are fully exposed to the weaker of the two economies. The fix isn’t to quit your job — it’s to stop treating equity exposure as optional garnish and start treating it as a hedge on your own earning power.
2. Ownership is the line, and it’s getting easier to cross — right when people are stepping back. Gallup found stock ownership fell to 58% of U.S. adults in April 2026, down from 62% a year earlier — the first decline since 2016. Among households earning under $50,000, only 28% own any stock at all. People are exiting the escalator in the same year the escalator did the heavy lifting. The cost of crossing that line is a brokerage account and an index fund. The cost of not crossing it compounds.
3. Automate it, don’t time it. The single biggest determinant of whether the ownership leg exists in ten years is whether the purchase happens without a decision. Payroll-deducted, auto-invested, boring. We covered the gap between good savings behaviour and actual balances in Americans Just Hit a Record 401(k) Savings Rate — Their Balances Fell Anyway, and the lesson stands: contribution rate is the part you control.
4. Don’t confuse “own assets” with “own one asset.” If the market is now a macro support beam, concentration risk is macro risk in your account. That’s the argument we made in The Nasdaq Fell 10% and the S&P Fell 4% — a cap-weighted index is far less diversified than it looks. Owning the market is the goal. Owning seven companies that happen to be the market is a different bet, and you should at least know you’re making it.
The uncomfortable summary
An economy where 20% of households drive 60% of spending, and where that group’s wealth is 90% concentrated in equities, is not a stable structure. It is a structure that produces record highs and negative payrolls in the same week, and both numbers are telling the truth about different halves of the country.
You don’t have to like it. You do have to decide which half of it your household balance sheet sits on. The moral case for a fairer distribution and the personal case for owning assets aren’t in conflict — the second is how individual families stop being spectators to the first. Waiting for the structure to change before you participate in it is the most expensive form of principle there is.
The K-shaped economy has been running for years. The only question it asks you is whether you’re on the line that goes up.
Want to track your own path to financial independence? The Wealtharian Wealth Tracker lets you monitor your net worth, FU money progress, and investment milestones in one place. Try it free →