
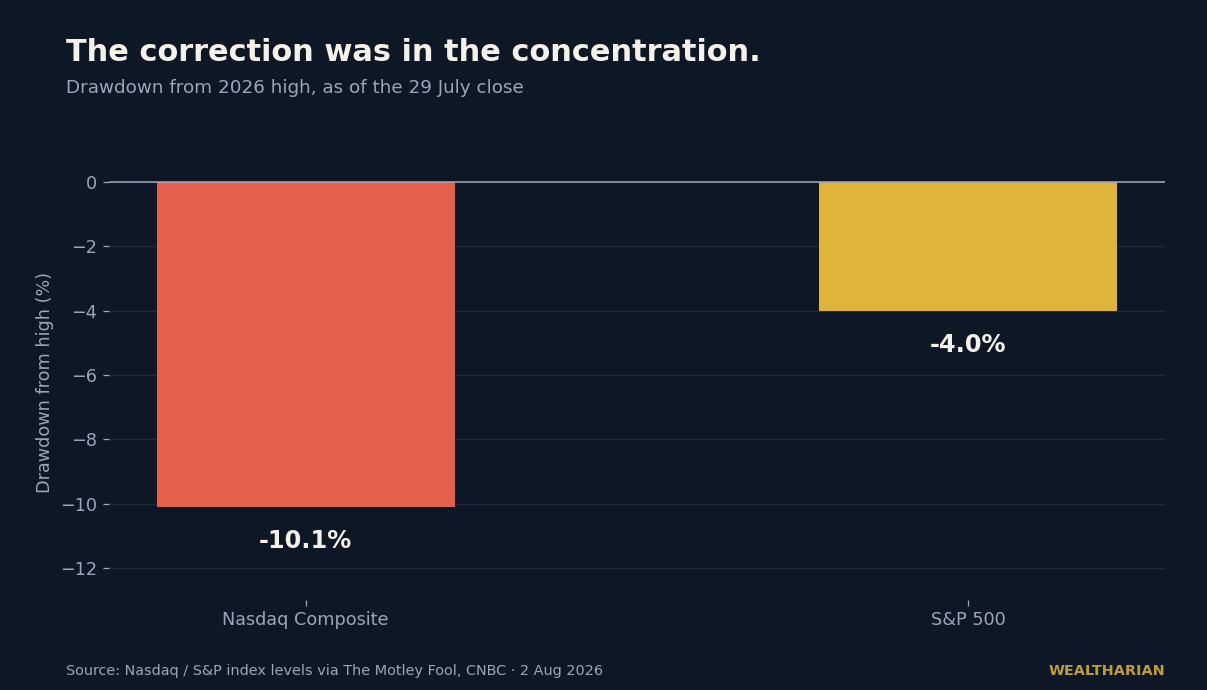
The Nasdaq Composite closed 29 July at 24,442.94 — 10.1% below its 1 June high of 27,190.21, its second correction of 2026 and its third in sixteen months. The S&P 500 that same day sat roughly 4% off its own high, and the Dow went on to post its fourth consecutive winning month.
Three indices. One market. A 6-point spread in the damage. That spread is not noise — it is the single most useful number in your portfolio right now, because it is the market telling you, out loud, that S&P 500 concentration risk has stopped being a theoretical footnote and started being a P&L event.
What actually happened: the correction was in the concentration, not the economy
Read the earnings tape and nothing looks broken. Of the roughly 300 S&P 500 companies that had reported by the end of July, 85% beat expectations, and aggregate profits for the index are tracking growth of more than 47%. RBC’s Lori Calvasina reiterated an 8,150 target on the index. The S&P closed 31 July at 7,489.72, up 0.70% on the day.
That is not what an economy in trouble looks like. It is what a crowded trade unwinding looks like. The selling was concentrated in the names that had absorbed the concentration, and the indices repriced in exact proportion to how much of those names they held.
Your “diversified” fund is a 31.5% bet on seven companies
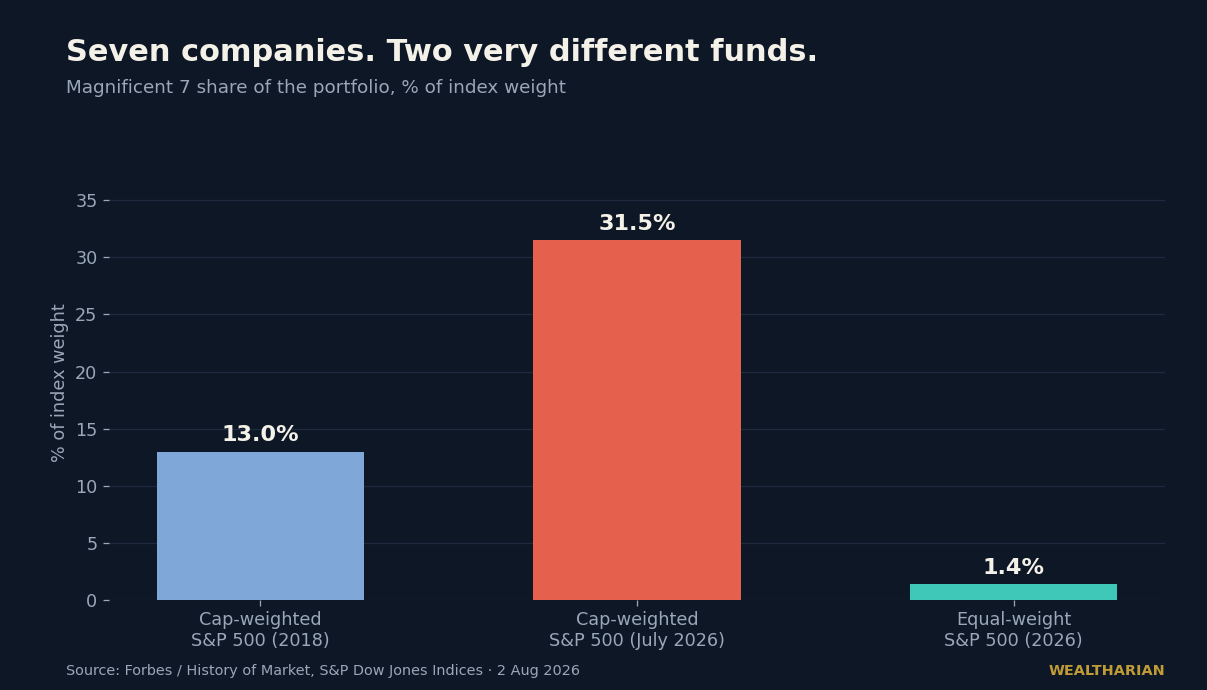
Here is the number most index investors have never looked up. As of 24 July 2026, the Magnificent Seven — Apple, Microsoft, Nvidia, Alphabet, Amazon, Meta and Tesla — accounted for 31.5% of S&P 500 market capitalisation. In early June that figure was closer to 34%. In 2018 it was 13%. This is the highest top-seven concentration since the Nifty Fifty of the early 1970s.
Now hold that next to the equal-weight version of the same 500 companies, where those seven names are 1.4% of the portfolio.
Same index. Same companies. Same country. A twenty-two-fold difference in how much of your money is riding on seven balance sheets.
This is the part that deserves a moment of honesty. Millions of people bought an S&P 500 fund specifically because it was the responsible, diversified, don’t-pick-stocks choice. They were told they owned 500 businesses. What they actually own is a large-cap tech fund with 493 companies attached as ballast. Nobody lied to them. The index simply did what a cap-weighted index is designed to do: it let the winners keep winning until the winners were the index.
The contrarian read: the drawdown is information, not damage
The consensus take on a Nasdaq correction is “risk-off, wait for the bounce, buy the dip.” That framing assumes the only variable is when. The more useful question is what.
Because the equal-weight S&P 500 has been quietly outperforming the cap-weighted index by roughly 2 percentage points year to date as of early July — and the gap was wider than 600 basis points back in February. Breadth is improving. Money is moving out of the seven and into the four hundred and ninety-three. That is not a crash. That is a rotation, and rotations reward the people who noticed early and punish the people who were still arguing about whether the top was in.
The trigger is not mysterious either. We have been tracking it here for weeks: investors have stopped paying for AI ambition and started demanding AI arithmetic. You could watch it happen in a single evening when Microsoft gained 8% and Meta lost 8% on the same night — identical spending, opposite verdicts. Add a 30-year Treasury at 5.21%, a 19-year high, and the discount rate applied to profits that arrive in 2031 gets brutal. Long-duration stories get repriced first. The Nasdaq is the long-duration story.
The $7.86 trillion sitting on the sidelines
Two records are being set at the same time, and together they explain the whipsaw better than any single indicator.
Money market funds held a record $7.92 trillion as of 17 June, with $3.09 trillion of that belonging to retail investors — also a record — and were still around $7.86 trillion in late July. Simultaneously, retail dip-buying in 2026 has exceeded prior peaks in magnitude, persistence and breadth.
Read that carefully. The same population is holding record cash and buying every dip with record aggression. That is not a contradiction; it is a barbell built by people who are not sure what they own. And it is fragile in a specific way: cash yielding 4-point-something is only comfortable while the Fed holds. With markets now pricing the possibility of hikes rather than cuts, that pile is one policy surprise away from being repriced too.
Four moves, not four tips
1. Look up your actual top-ten weight. Not your fund’s name — its holdings page. If seven tickers are 30%+ of your net worth, you have made an active bet. Own it consciously or don’t own it.
2. Decide whether you want cap-weight or equal-weight on purpose. Cap-weight wins when leadership is narrow. Equal-weight wins when breadth broadens — which is precisely what 2026 has been doing. Neither is “right.” Choosing by accident is wrong.
3. Stop treating a 10% index drawdown as a single event. A correction concentrated in seven names is a completely different signal from a correction that hits four hundred. The first is a rotation you can position for. The second is a recession you hedge for. This one was the first.
4. Give your cash a job and a deadline. “Waiting for clarity” is not a plan, it is a fee you pay in foregone compounding. It is the same behavioural trap we saw when Americans hit a record 401(k) savings rate and watched balances fall anyway — record effort, misdirected allocation.
The bottom line
Nothing broke in July. Earnings are strong, breadth is improving, and the index that “corrected” corrected mostly in the seven places it was most crowded. The real event was that the market handed every index investor a free, non-destructive stress test of their own concentration — a 10% shake that cost the average S&P holder 4% and told them exactly how much of their financial future is denominated in Nvidia.
Most people will read the headline, feel the dip, and change nothing. The small number who open their holdings page this week will find out what they actually own — and that is worth more than any forecast about where the Nasdaq goes next.
Do you know your top-ten weight? Or have you been assuming the word “diversified” was doing that work for you?
Want to track your own path to financial independence? The Wealtharian Wealth Tracker lets you monitor your net worth, FU money progress, and investment milestones in one place. Try it free →