
Oil has fallen more than 7% in four trading sessions. Under every macro playbook written since 1974, that is the moment long-term bond yields fall too. Instead, the US 10-year just touched 4.75% — a 20-month high.
Falling oil prices and rising long yields are not supposed to happen at the same time. When they do, it is not noise. It is the bond market telling you something the equity market is too distracted to hear — and almost everyone is watching the wrong screen today.
What falling oil prices are supposed to do
The mechanism is simple. Energy is an input cost in nearly everything — freight, plastics, fertiliser, air travel, food. When crude drops, headline inflation drops with a lag of a few months. Lower expected inflation means bondholders demand less compensation, so yields fall. Cheaper energy also acts like a tax cut for consumers, which is mildly growth-positive.
So the textbook trade is: oil down, yields down, bonds up, mortgage rates ease, and the Fed gets room to cut. That is the reflex the market has been trained on for fifty years.
It just failed. Crude sat at $80.47 on Wednesday, down 2.3% on the day and down over 7% since Friday. Brent closed at $88.58 on Tuesday. And the 10-year went up, hovering near 4.66–4.75%, its highest since late 2024.
Why oil is actually falling — and why that changes the signal
Here is the part the “cheap gas is good news” crowd is skipping: why a price falls matters more than the fact that it fell.
If oil drops because supply surged — a new field, an OPEC+ unwind, a technology shift — that is genuinely disinflationary and genuinely good for consumers. Real income goes up, nothing else breaks.
If oil drops because demand is disappearing, that is a different animal entirely. It is not a discount. It is a symptom.
This time it is mostly the second. In its August report, the IEA cut its 2026 oil demand forecast by 1.6 million barrels per day — roughly 510,000 b/d worse than what it projected only a month earlier. OPEC cut its outlook too. US inventories built sharply. Layered on top, the geopolitical risk premium is unwinding: signs of diplomatic movement between Washington and Tehran, and US sanctions measures that landed milder than markets had braced for.
Strip that apart and you get: a modest supply-side relief story sitting on top of a significant demand-destruction story. Falling oil prices driven by collapsing demand are not a gift to your portfolio. They are the market marking down its own forecast of global growth.
The bond market isn’t buying the disinflation story
If long yields were being set purely by inflation expectations, a 7% oil crash would have pulled them down. They went the other way. That tells you the long end is being priced by something other than the inflation outlook.
Look at the shape of the curve rather than its level.
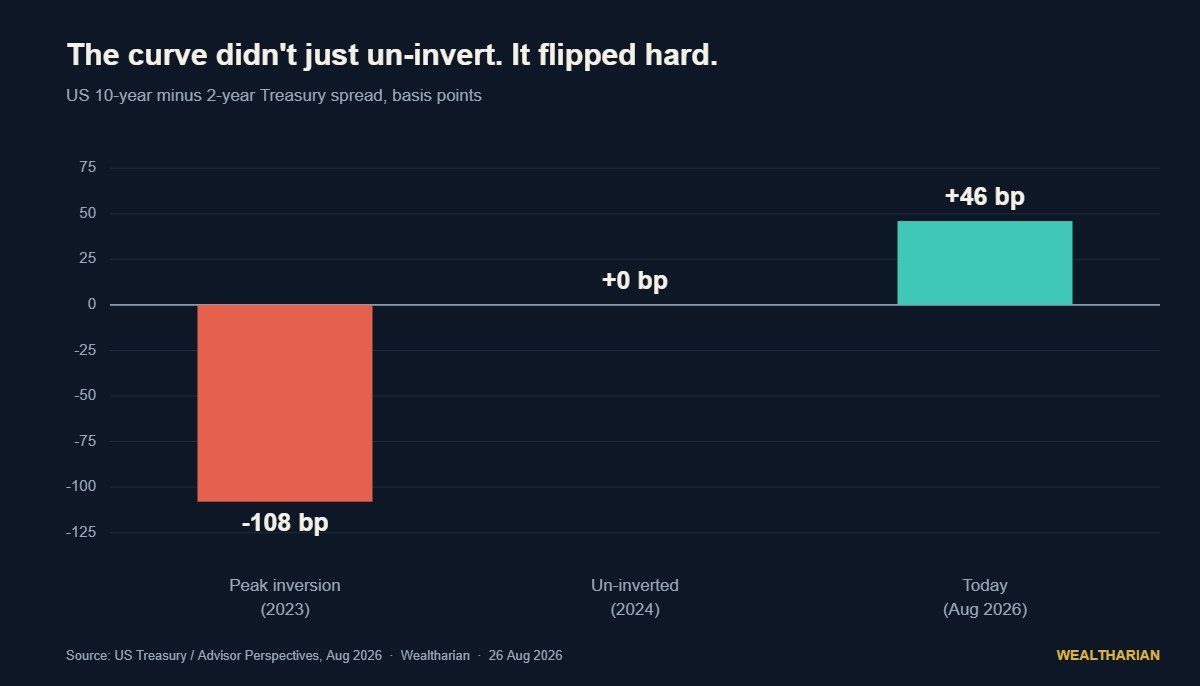
The 2-year sits around 4.15–4.17%. The 10-year is near 4.66%. That is a spread of roughly +46 basis points — and it has travelled all the way from a peak inversion of −108bp. The curve did not gently normalise. It bear-steepened: long rates rising faster than short rates.
A bear steepener that persists while oil is collapsing is a specific message. It says the extra yield being demanded at the long end is not about next year’s CPI print. It is about term premium — compensation for fiscal deficits, heavy issuance, and uncertainty about who is going to absorb all that paper. Persistent concerns over wider deficits and heavy corporate debt issuance have been pushing long yields up all month, to the point that Treasury has been doubling liquidity-support buyback operations for longer-dated bonds.
We have made this argument before in a different form: when the 30-year TIPS real yield hit 3%, that was the market repricing the cost of capital itself, not its inflation forecast. Same phenomenon, new evidence.
And the Fed is not riding to the rescue
The other half of the reflex — “cheap oil gives the Fed room to cut” — assumes the Fed is looking for an excuse to ease. It isn’t.
Inflation is still running at 3.4%, well above the 2% target. Kevin Warsh took over as Fed Chair in May and brings a hawkish record from his 2006–2011 stint on the Board. He delivers his first Jackson Hole keynote on Friday. And futures are not pricing cuts at all.
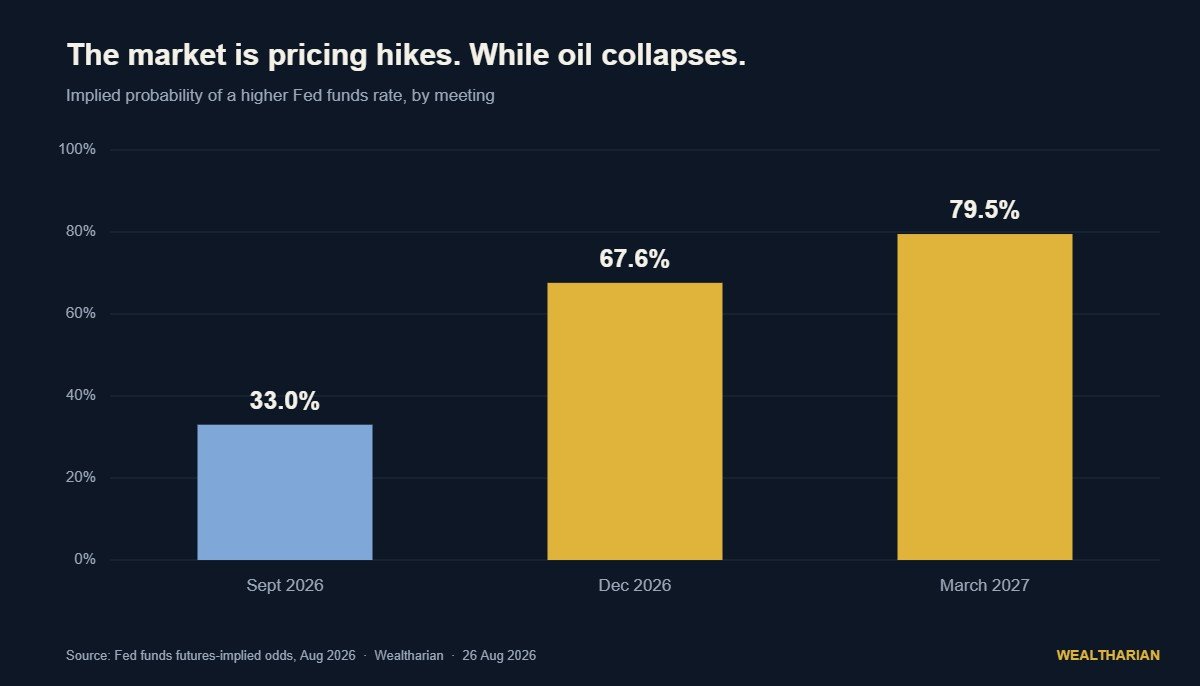
Roughly a one-in-three chance of a hike in September. About 67.6% by December. Nearly 80% by March 2027. As we argued when the odds first shifted, the rate hike didn’t get cancelled — it got rescheduled. Falling oil has not changed that math, because falling oil is not what is worrying the Fed. Services inflation and fiscal supply are.
What this actually means for your money
Four concrete consequences, none of which require you to predict anything.
1. Your bond fund is not the safe part of your portfolio. For three years the consensus advice was “lock in yields before rates fall — extend duration.” A lot of people took it. If long yields keep grinding higher on term premium rather than inflation, long-duration bond funds keep taking price hits. Find out the effective duration of every bond fund you own. If you do not know that number, you do not know your risk.
2. Cheap energy will not rescue your mortgage. The 30-year fixed is sitting around 6.56%, and it tracks the long end of the Treasury curve, not the oil price. If you have been waiting for a sub-5% refinance window, a crude selloff does not deliver it. Fannie Mae’s own outlook has rates near 6.4% for the rest of the year. Underwrite your housing decisions at today’s rate, not a hoped-for one.
3. Cash is a position, not a parking space. There is a record $8.28 trillion sitting in US money-market funds, and it is habitually described as “dry powder waiting on the sidelines.” That framing is lazy. Cash has zero duration, and in a bear-steepening regime zero duration is a deliberate, defensible allocation — not cowardice. What it is not is automatic: yields on short-term cash have drifted down toward 3–4% in many places, and plenty of savings accounts pay a rounding error. Being in cash is fine. Being in lazy cash is not.
4. Treat “cheap oil is bullish” with suspicion this cycle. Energy equities reprice fast on crude. But the sectors people rotate into on a cheap-oil narrative — airlines, transport, consumer discretionary — are precisely the ones exposed to the demand slowdown that is causing the price drop. You cannot have the input-cost benefit without the revenue risk that comes attached to it.
The number that matters this week
Wall Street will spend today staring at a single earnings release. Fine. But the number that will still matter in twelve months is the one printing quietly on the long end of the curve.
Watch two things. First, Warsh on Friday: whether he validates the hike-tilted pricing or leans against it. Second, and more important, whether the 10-year holds above 4.6% even as oil stays soft. If it does, the market has decided that the price of long-term money is being set by fiscal reality rather than by the inflation cycle — and that reprices mortgages, bonds, and every long-duration asset you own, regardless of what happens to a barrel of crude.
Cheap oil is not the all-clear. Sometimes it is the warning.
Want to track your own path to financial independence? The Wealtharian Wealth Tracker lets you monitor your net worth, FU money progress, and investment milestones in one place. Try it free →