
The scariest number in American consumer finance right now — credit card balances 90+ days delinquent jumping from 7.6% to 12.8% — is partly an accounting artifact. And the boring explanation behind it is far more dangerous to your net worth than the scary headline ever was.
On August 11, the New York Fed published research reconciling two of its own credit card delinquency measures that had been telling opposite stories. One said American households were falling apart at rates not seen since the Great Recession. The other said they were fine — stressed, but stable. Both were right. And what sits between them is a quiet machine that is permanently raising the cost of capital for roughly 23 million people.
Two Measures, Two Realities
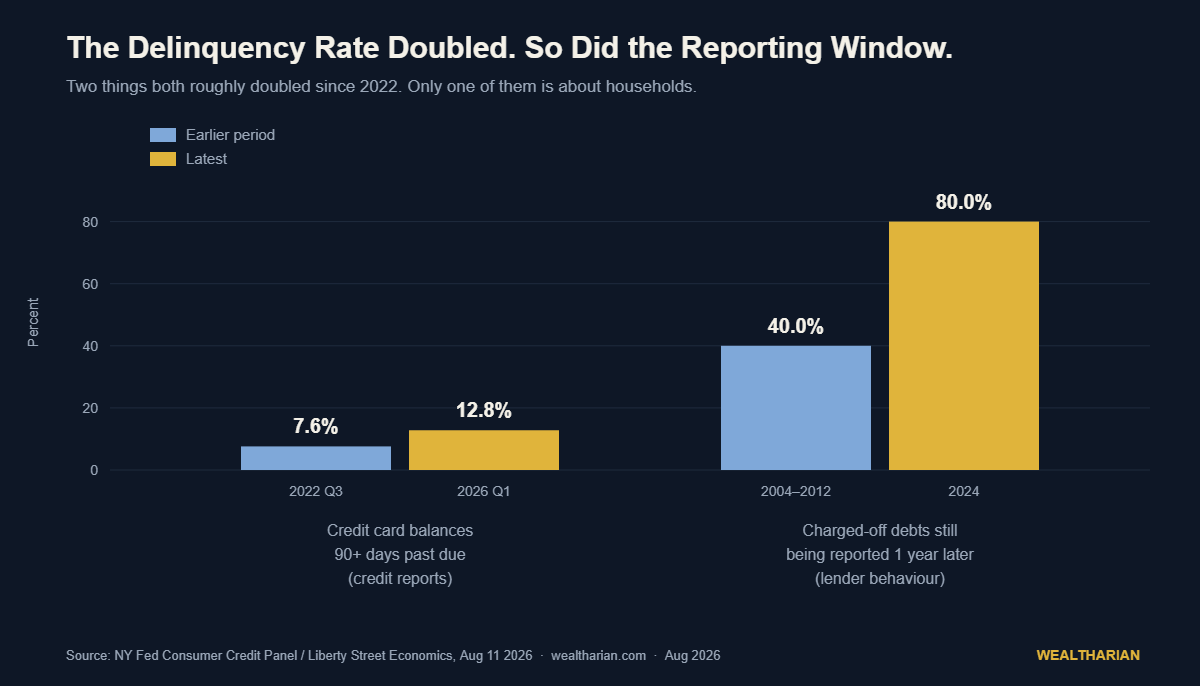
The New York Fed runs a stock delinquency rate: the share of all balances currently reported on credit files that are 90+ days past due. That’s the one that went from 7.6% in Q3 2022 to 12.8% in Q1 2026 and generated the Great Recession headlines.
It also runs a flow rate: the share of balances that newly fell 90+ days behind this quarter. That one has been roughly flat since early 2024. Bank call reports, which measure 30+ day delinquency on lenders’ own books, agree with the flow rate.
So why the gap? When a card is charged off — usually between 120 and 180 days past due — the balance leaves the lender’s balance sheet. It exits the numerator and the denominator in one motion, registers once, and disappears from bank data forever. But you still owe it. The lender still pursues it. And the credit bureaus keep carrying it.
Strip the charged-off balances out of the stock measure and all three lines converge. The New York Fed’s conclusion is blunt: the rise in the stock rate has been driven almost entirely by a growing pool of severely derogatory balances, not by a fundamental worsening in how often households fall behind.
Which sounds like good news. It isn’t.
The Number That Actually Changed
Here’s the finding almost nobody picked up. Between 2004 and 2012, about 40% of a borrower’s charged-off debts were still being reported to the bureaus one year later. By 2024, that figure had doubled to 80%.
Lenders didn’t get worse at collecting — the CFPB’s recovery rates barely moved. They simply started keeping bad debt visible on credit files for twice as long.
That is not a macroeconomic event. It’s a reporting-practice change. And it did something no recession statistic captures: it doubled the duration of financial punishment for tens of millions of people, without a single vote, headline, or policy announcement.
More than 23 million Americans are currently carrying charged-off credit card balances on their credit reports. That’s roughly one in nine adults walking around with a scarlet letter that used to fade in twelve months and now sticks for two years or more.
Why a Credit File Is a Balance Sheet Item
Most people think of a credit score as a permission slip — you either get the loan or you don’t. That framing costs enormous amounts of money, because a credit file isn’t a gate. It’s a price.
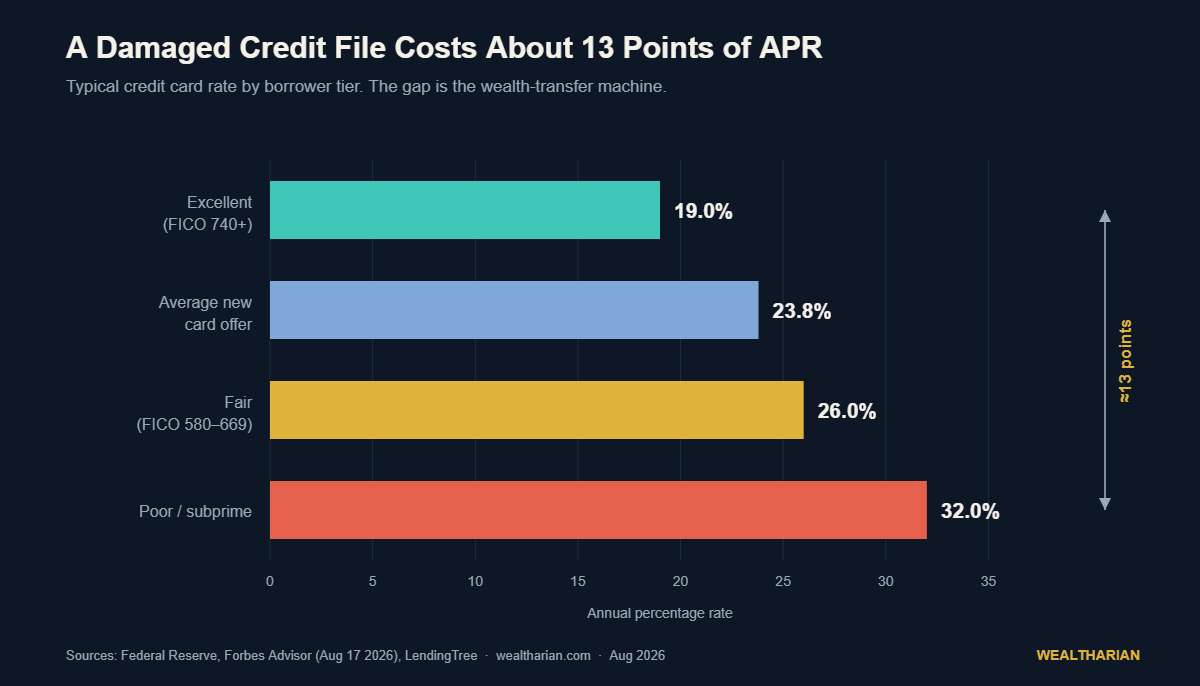
Right now the average APR on a new card offer is 23.8%. A borrower with excellent credit gets roughly 17–21%. Someone in the fair range pays 24–28%. Subprime borrowers see 28% and up, with some cards touching 36%.
Call it a 13-point spread between a clean file and a damaged one. On a $6,000 revolving balance, that’s about $780 a year — every year — in pure interest differential. Not on the debt. On the reputation of the debt.
Extend that across mortgages, auto loans, insurance premiums in states that permit credit-based pricing, and rental applications, and the annual cost of a scarred file for a median household runs into the low thousands. Compound that gap over the two extra years lenders now keep the mark visible and you have a wealth transfer that is invisible, automatic, and completely absent from the delinquency debate.
The doom crowd is arguing about whether the consumer is cracking. Meanwhile the actual mechanism — how long a mistake gets to keep charging you rent — changed quietly, and it changed in the lenders’ favour.
This Is What the K-Shape Actually Looks Like
Zoom out and the picture gets sharper. Total household debt fell $13 billion in Q2 2026, to $18.8 trillion. Card balances rose to about $1.26 trillion. The 30-day delinquency rate has now declined for seven straight quarters. On paper, a healing consumer.
But New York Fed researchers also found that the top 10% of households account for nearly 23% of all consumer spending, while the bottom 10% account for just 4%. Retail sales fell 0.6% in July, the steepest drop since May 2025. Employers shed 23,000 jobs. Labour force participation hit its lowest level since 1976 outside the pandemic. Consumer sentiment slid about 8% to a preliminary reading of 51.
Aggregate data averages a household buying its third car with a household choosing between petrol and groceries. We’ve made this exact argument about consumer sentiment — and it’s the same structural point that made last quarter’s household debt “decline” misleading. The average is not a person. Nobody lives at the mean.
What Actually Follows From This
1. Treat your credit file as an asset with a yield. Moving from “fair” to “excellent” is worth roughly 5–9 points of APR on revolving debt and considerably more over a mortgage term. There is no equity allocation that reliably delivers a guaranteed 7% spread. Fixing your file often does — and the return is tax-free, because avoided interest isn’t income.
2. If you have charged-off debt, the clock is longer than you think. The old mental model — it disappears in about a year — is obsolete. Pull your full report from all three bureaus, confirm what’s actually being reported and for how long, and dispute anything past the statutory window. Reporting duration doubled; borrower awareness of it did not.
3. Don’t buy the “consumer is collapsing” trade on the stock delinquency number. If you were positioning for a consumer credit blowup based on 12.8%, the flow data doesn’t support you. Elevated, yes. Accelerating, no. Being early and being wrong pay the same.
4. Don’t buy the “consumer is fine” trade either. Falling retail sales, a shrinking labour force, and sentiment at 51 are not the profile of a healthy household sector. The stress is real. It’s just concentrated in people who don’t move aggregate statistics — which is precisely why it’s underpriced.
5. Understand which side of the machine you’re on. Someone earns that 13-point spread. Card issuers, subprime lenders, and debt buyers monetise exactly this asymmetry. You can be a customer of that system or a part-owner of it — but you should at minimum know it exists, and know that “the data got better” and “people got better off” are two entirely different claims.
The Real Lesson
The financial system rarely takes money from you dramatically. It takes it through duration, defaults, and definitions — the settings nobody campaigns about. A reporting-practice change buried in a Fed research blog will cost ordinary households more, in aggregate, than most of the policies that dominated the news cycle this month.
The people who build wealth are not the ones with the best forecast. They’re the ones who read the footnote, understand which number is measuring reality and which is measuring bookkeeping, and act on the difference. That habit compounds — the same way a record savings rate can coexist with falling balances if you don’t ask what’s underneath the headline.
Delinquency didn’t double. The punishment did. That’s the story.
Want to track your own path to financial independence? The Wealtharian Wealth Tracker lets you monitor your net worth, FU money progress, and investment milestones in one place. Try it free →