
On Thursday the S&P 500 closed at 7,798.99 — the 27th record high of 2026. On Friday morning the University of Michigan reported that consumer sentiment had fallen to 51.0, an 8% collapse in four weeks. Every headline called this a disconnect. It is not a disconnect. It is a scoreboard, and most Americans are reading it from the wrong side of the field.
A disconnect implies one of the two numbers is lying. Neither is. They are measuring two different economies that happen to share a currency, a flag and a set of ZIP codes. Consumer sentiment measures what it feels like to earn money in America. The index measures what it feels like to own things in America. Those two experiences drifted apart years ago. In August 2026 they stopped pretending.
Forty-eight hours, two economies
Here is the raw sequence, without interpretation:
- Thursday: the S&P 500 closes at a record 7,798.99, its 27th all-time high of the year, up 13.4% year to date. The Nasdaq ends at 26,803.03, the Dow at 53,839.99.
- Friday: the University of Michigan preliminary sentiment index prints 51.0, down from 55.2 in July and below the 55.0 consensus. Year-ahead inflation expectations rise to 4.3%, versus 3.4% in February.
- Same morning: July retail sales fall 0.6%, the largest monthly drop since May 2025. Online sales fall 2.2%.
For context, the actual record low in the sentiment series was 44.8, set in May of this year. The market gained 13.4% anyway.
One number tracks paycheques. The other tracks portfolios.
For the large majority of American households, essentially all income is labour income. When groceries, rent and fuel rise faster than wages, sentiment falls — correctly. That survey is doing its job.
The S&P 500 is not a poll of those households. It is a price for a claim on corporate earnings, and the marginal buyer of that claim is not the median American. Gallup’s April 2026 survey found that 58% of U.S. adults own stock in any form — including a 401(k) — down from 62% a year earlier. That is the first decline since 2016.
Break it down by income and the two economies appear in a single chart:
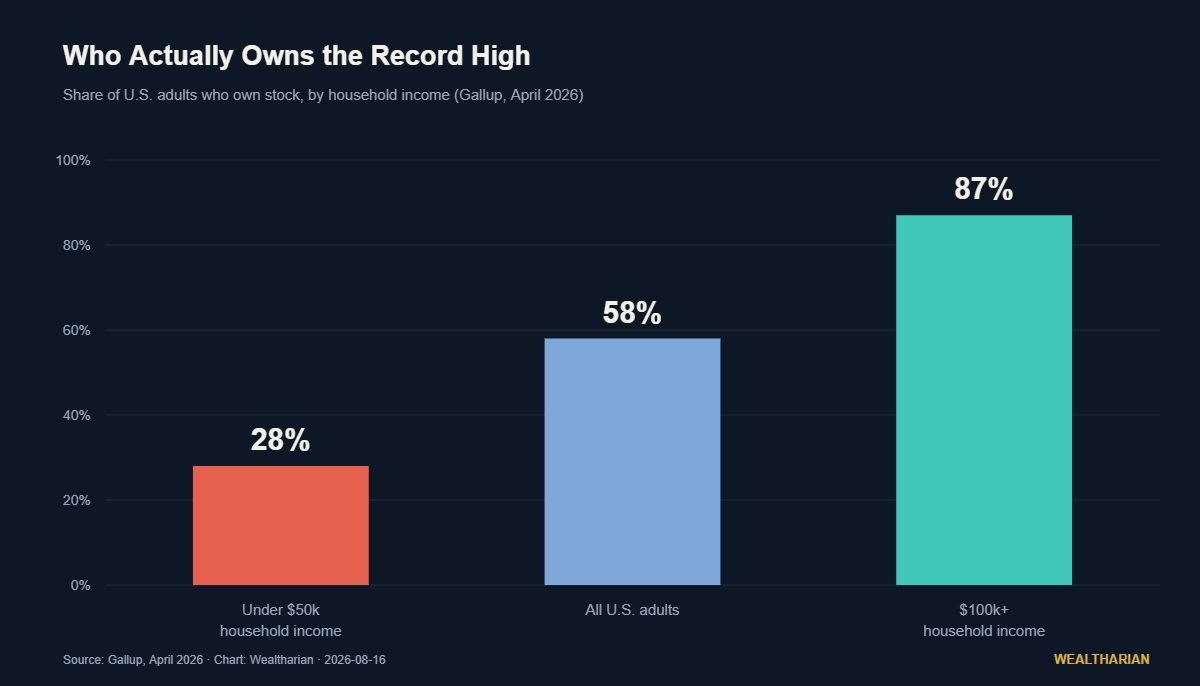
A 13.4% year is a materially different event depending on which bar you live in. For one group it is compounding — a real, measurable change in the date they could stop working. For the other it is a headline about someone else’s money. Same country, same year, same news cycle. We have written before about how the K-shaped economy now runs on portfolios rather than paycheques — this week was that thesis printed in two data releases twelve hours apart.
The contrarian read: this is not a sell signal
The consensus interpretation of a sentiment print like this is bearish and mechanical: the consumer is roughly 70% of GDP, sentiment leads spending, spending leads earnings, therefore de-risk. There are two problems with that chain.
First, sentiment stopped predicting spending. Since 2021 the index has behaved less like a forecast and more like a mood ring for fuel prices and politics. The survey itself notes that Republican respondents are now 19% below their pre-Iran-conflict readings, with the sharpest declines among older, lower-income and non-college respondents. That is a real description of how people feel. It is a poor description of what they will do at the till, which is why the last four years of “sentiment says recession” calls have been wrong.
Second, “the consumer is 70% of GDP” hides the identity of the consumer.
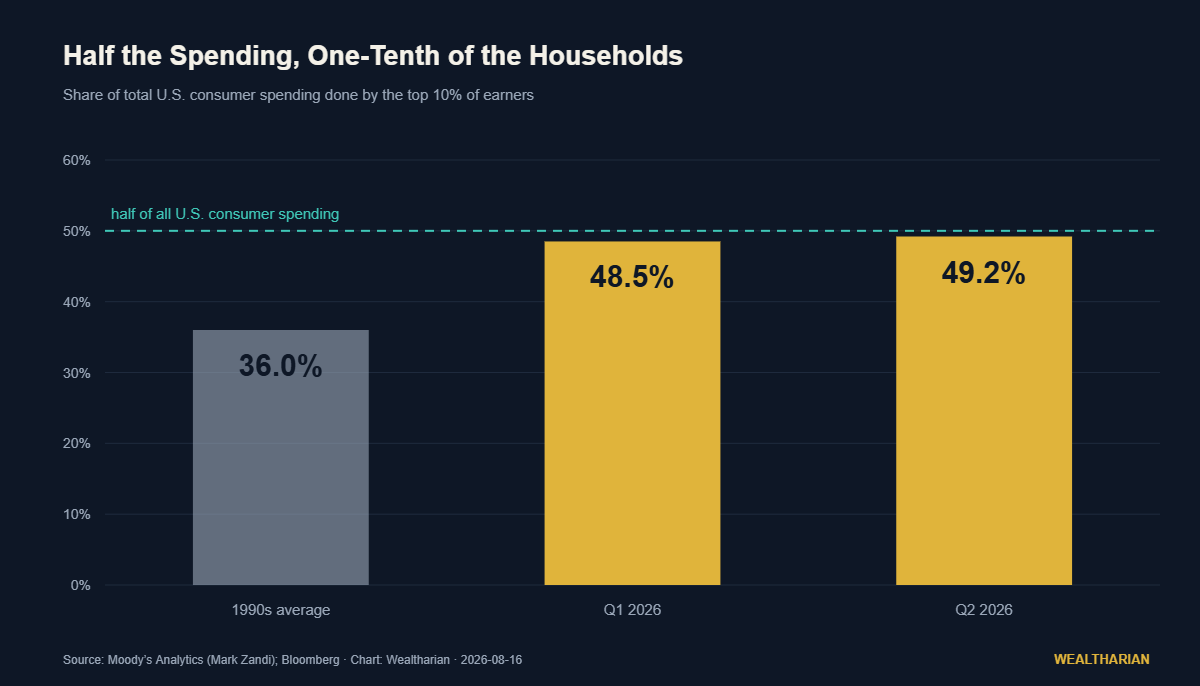
Moody’s Analytics chief economist Mark Zandi estimates the top 10% of earners — roughly $250,000 and up — now account for 49.2% of all U.S. consumer spending, up from 48.5% in Q1 and around 36% three decades ago. Some economists dispute the exact level, and the BEA’s methodology produces a much lower figure, so treat the number as a direction rather than a decimal. The direction is not in dispute.
That cohort’s spending is financed substantially by asset values. So a record index is not a contradiction of their consumption. It is the engine of it. The sentiment of the bottom half of the distribution can fall to 44.8 without breaking the earnings line, because the bottom half was never the marginal dollar.
The honest bear case is different and much narrower than the one being sold: corporate earnings increasingly depend on the wealth effect generated by the same market that prices those earnings. That is a reflexive loop, and reflexive loops unwind faster than they build. But that is a fragility argument about concentration, not a “sentiment says sell” argument. Confusing the two has cost people three years of returns.
The expensive emotion
When you see a record you did not participate in, the natural reaction is to conclude the game is rigged and refuse to play. That reaction is understandable and it is the single most expensive emotion in personal finance.
Gallup’s 62% to 58% is that emotion, measured. Four percentage points of American adults left the ownership side of the line during a year in which the ownership side rose 13.4%. Sitting out did not punish anyone. It simply moved those households from the top of the K to the bottom of it.
It also compounds a second problem. When asset income is unavailable, consumption gets financed by credit instead — which is why the recent “improvement” in household balance sheets deserves scepticism. We took that apart in household debt fell for the first time since COVID — it didn’t actually fall.
What to actually do with this week
- Stop treating the index as a report card on your life. It is the price of one asset class. If you own it, it is your news. If you do not, it is a stranger’s.
- Convert income into ownership on a schedule you are not allowed to renegotiate. The entire gap between the two bars in the first chart is participation, not timing, not stock-picking and not intelligence.
- Calculate your own inflation rate. The 4.3% expectation is an average across people with radically different baskets. If your spending is weighted to rent, groceries and fuel, your personal rate is higher — which means the return you need to stand still is higher too.
- Don’t read the Fed’s patience as an all-clear. Cooling core inflation is what lets the Fed sit still; it is not the same as a cutting cycle. The rate risk has been rescheduled, not cancelled.
- Size your cash for a reflexive drawdown, not a textbook recession. If a meaningful share of top-decile spending is funded by portfolio gains, a market fall is also a demand shock — and job losses would arrive faster than the usual playbook assumes.
The part worth saying plainly
An economy where the index prints records while half the country feels poorer is not a healthy arrangement, and pretending otherwise is how you end up writing cheerful newsletters that nobody trusts. A market that no longer requires the median household to prosper has removed its own broadest safety net. That is worth naming.
But naming it is not the same as opting out of it. The rules of this arrangement are not going to be rewritten in time to matter for your retirement. The only lever you personally control is which side of the ownership line you stand on — and unlike almost everything else in this story, that one is still open to you at any income level.
Consumer sentiment at 51 is not telling you the market is wrong. It is telling you how many people are watching from outside.
Want to track your own path to financial independence? The Wealtharian Wealth Tracker lets you monitor your net worth, FU money progress, and investment milestones in one place. Try it free →