
Brent crude closed at $100.69 a barrel this week, the first time oil has traded above $100 since May. The average American now pays $4.10 for a gallon of gasoline, up roughly 20% in a year. Crude is up more than 30% this month alone.
And the bond market’s forecast for inflation over the next decade? 2.24%.
That gap — a screaming commodity and a shrugging bond market — is the single most useful piece of information available to an investor right now. Most people are about to read it backwards.
The gap nobody is pricing correctly
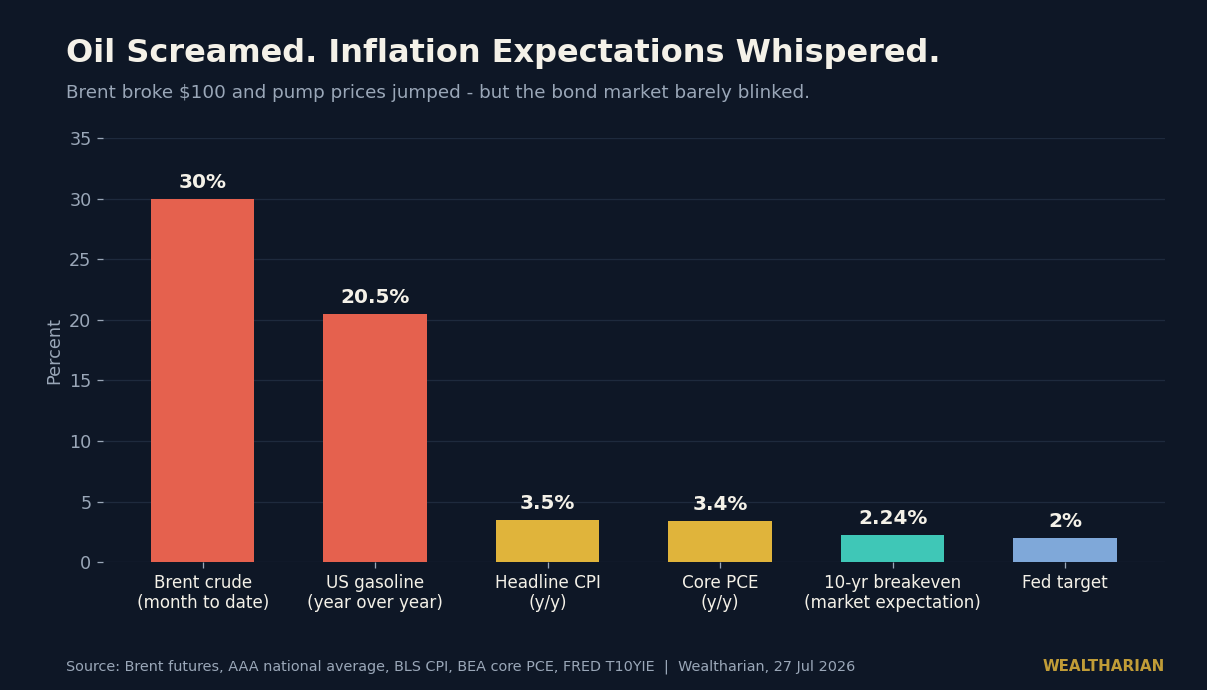
Look at the spread. Brent is up about 30% month-to-date. Pump prices are up 20.5% year over year. Headline CPI sits at 3.5% and core PCE at 3.4% — both uncomfortably above target. But the ten-year breakeven rate, which is the market putting real money behind a real inflation forecast, is at 2.24%. That is barely above the Fed’s 2% target and roughly where it sat before any of this started.
The bond market is making a specific, falsifiable claim: this is a price level shock, not an inflation regime. A missile changes the price of a barrel. It does not change the long-run rate at which prices rise. Supply shocks are one-time hits that wash out of the year-over-year data twelve months later — unless they get embedded in wages and expectations. Bond traders, who lose their jobs when they get this wrong, are betting they won’t be.
History is on their side. The 2022 spike took Brent to $128 after Russia invaded Ukraine. Within a year oil was back under $70. The investors who got hurt were not the ones who ignored the shock. They were the ones who rebuilt their entire portfolio around it at the top.
The energy trade already happened
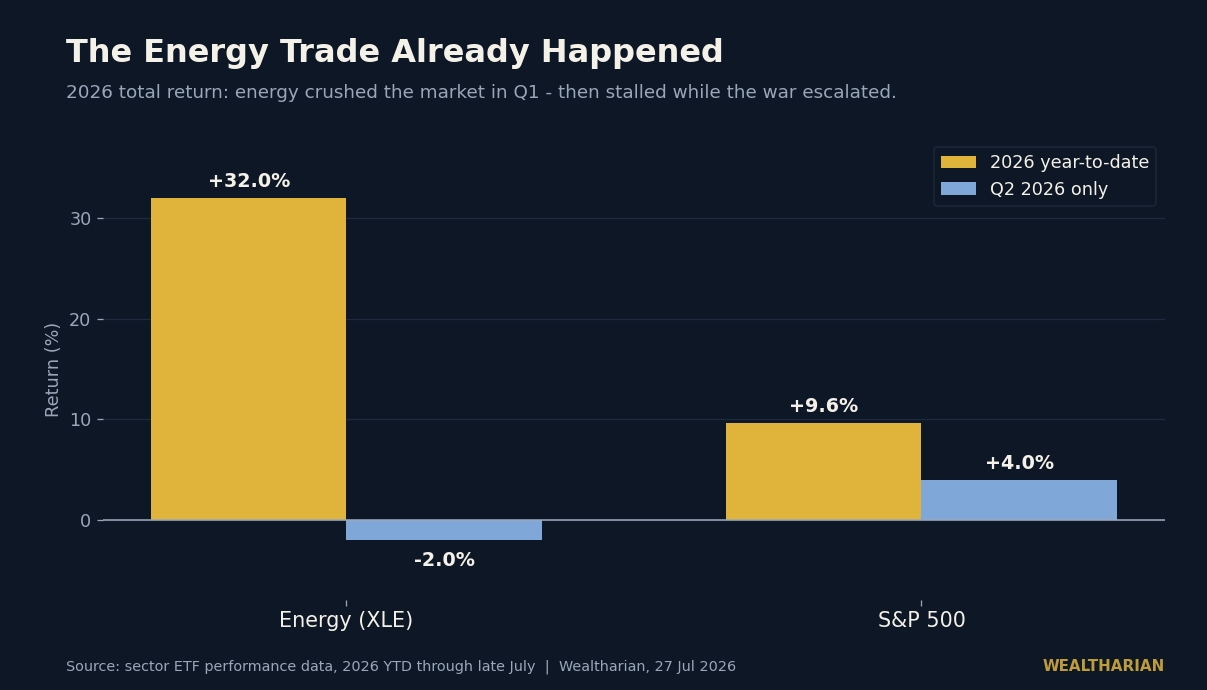
Here is the statistic that should stop you before you hit the buy button on an energy ETF.
The energy sector is up about 32% in 2026 against 9.6% for the S&P 500. Enormous outperformance. But nearly all of that gain arrived in the first quarter. In Q2 — the quarter in which the Middle East conflict escalated, tankers were attacked, and the Strait of Hormuz became a daily headline — the energy sector was down about 2%, the second-worst performing sector in the market.
Read that again. The war got worse and energy stocks went down.
That is not a market malfunction. That is how markets work. Prices move on the change in expectations, not on the news. By the time a geopolitical risk is on the front page, it is in the price — and often over-priced, because the front page is where retail money arrives. This is the same lesson July’s $1.5 trillion head-fake taught anyone paying attention: the headline and the opportunity almost never arrive on the same day.
The real risk is the Fed’s reaction, not the oil price
The FOMC meets July 28-29 with rates at 3.50-3.75%. Markets put roughly 65% odds on no change, but the probability of an outright hike has jumped to about 31% from 13% — driven almost entirely by the oil move. Odds of a September hike sit near 82%.
Think about what that means. Higher oil is a tax on consumers and a hit to growth. It is, in economic terms, closer to a recession input than a boom input. The textbook response to a supply shock is to look through it, because raising rates does not produce more barrels of crude.
But a central bank that has spent five years above its inflation target does not have the credibility to look through anything. So the danger in this setup is not that oil at $100 wrecks your portfolio. It is that a Fed with something to prove tightens into a supply shock — raising the discount rate on every long-duration asset you own precisely as the economy is already absorbing an energy tax. That is the mechanism that turns a commodity headline into an equity drawdown.
Which is why the correct posture toward this week is the one we argued in rate cuts were never a wealth plan. You do not build wealth by forecasting a committee. You build it by owning assets whose value does not depend on the committee being kind to you.
Your biggest oil exposure isn’t in your portfolio
Here is the part almost nobody runs the numbers on.
The average US household is projected to spend around $2,083 on gasoline this year. A 20% move in pump prices is therefore worth roughly $400 a year to a typical family — real money, paid in cash, every week, with no tax deferral and no compounding to soften it.
Now compare the effort. People will spend a weekend researching an energy ETF in the hope of capturing a few hundred dollars of upside on a position they will probably buy late. The same few hundred dollars is available with certainty by combining trips, checking tire pressure, and using a cash-back card on fuel. One requires being right about a war. The other requires nothing but attention.
This is the same asymmetry we found in the AI tax on your power bill: the energy line in your household budget is a controllable expense that most people treat like weather, while the energy line in their portfolio is uncontrollable and they treat it like a decision.
What to actually do this week
Don’t chase energy after a 32% run. If you had no energy exposure in January, buying now means paying for a thesis the market already priced — and Q2 showed you what happens when the news is good and the stock still falls.
Do check whether you have any. Most broad index investors already hold energy inside the S&P 500. If your only reason to add more is a headline, you are not diversifying, you are concentrating.
Watch earnings, not the Fed. This week brings Microsoft, Meta, Apple, Amazon, Visa, Boeing and Coca-Cola, plus Chevron and Exxon on Friday. S&P 500 companies are expected to post roughly 38% year-over-year earnings growth for Q2. Cash flows are the thing you actually own. A single Fed sentence is the thing you cannot control.
Fix the cash-flow leak first. The $400 of fuel inflation is guaranteed. Your energy trade is not.
The bond market has quietly told you it thinks this ends. Position for it being right, and make sure you survive it being wrong. Those are two different jobs, and most portfolios only do one of them.
Want to track your own path to financial independence? The Wealtharian Wealth Tracker lets you monitor your net worth, FU money progress, and investment milestones in one place. Try it free →