
In three weeks, roughly $1.5 trillion of semiconductor market value evaporated and every headline said the AI bubble was finally bursting. Within days of the bottom, inflation printed its first monthly decline in six years and earnings season opened with the best beat rate in more than three years. If you sold into that panic, you just paid the most expensive tuition in investing: the market timing lesson.
July 2026 will end up in textbooks, because it compressed the entire case against market timing into twenty-one days. The crash was real. The recovery evidence was real. And the gap between what the headlines said and what the data said was wide enough to drive a portfolio through. Let’s walk through what actually happened — and what to do differently, permanently.
Three weeks of headlines vs three days of facts
The setup: from its late-June record, the Philadelphia Semiconductor Index fell roughly 24% — an official bear market for the most important sector of the decade, erasing about $1.5 trillion in value, more than the GDP of Spain. The stated reasons stacked up like a doom checklist: AI monetization skepticism, a hawkish new Fed openly discussing a hike, oil pushed higher by US–Iran hostilities. We covered the split verdict on AI itself in The AI Bubble Just Split in Two — but the behavioral story is bigger than AI.
Then the facts landed, in rapid fire. June CPI fell 0.4% on the month — the first monthly decline in prices in six years — dragging annual inflation from 4.2% to 3.5%. Odds of a July rate hike collapsed from roughly 42% to about 16% almost overnight. Q2 earnings season opened with 88% of the first fifty S&P 500 reporters beating estimates — against a 68% historical average — with beats coming in 16.4% above forecasts and blended earnings growth near 23% year over year. Goldman Sachs, Morgan Stanley, Bank of America and BlackRock didn’t just clear the bar; they cleared it with room to spare — a sharp reversal from the priced-for-perfection regime we flagged earlier this year. And on July 21, Micron rose 12% in a single session as semiconductors led the Nasdaq higher.
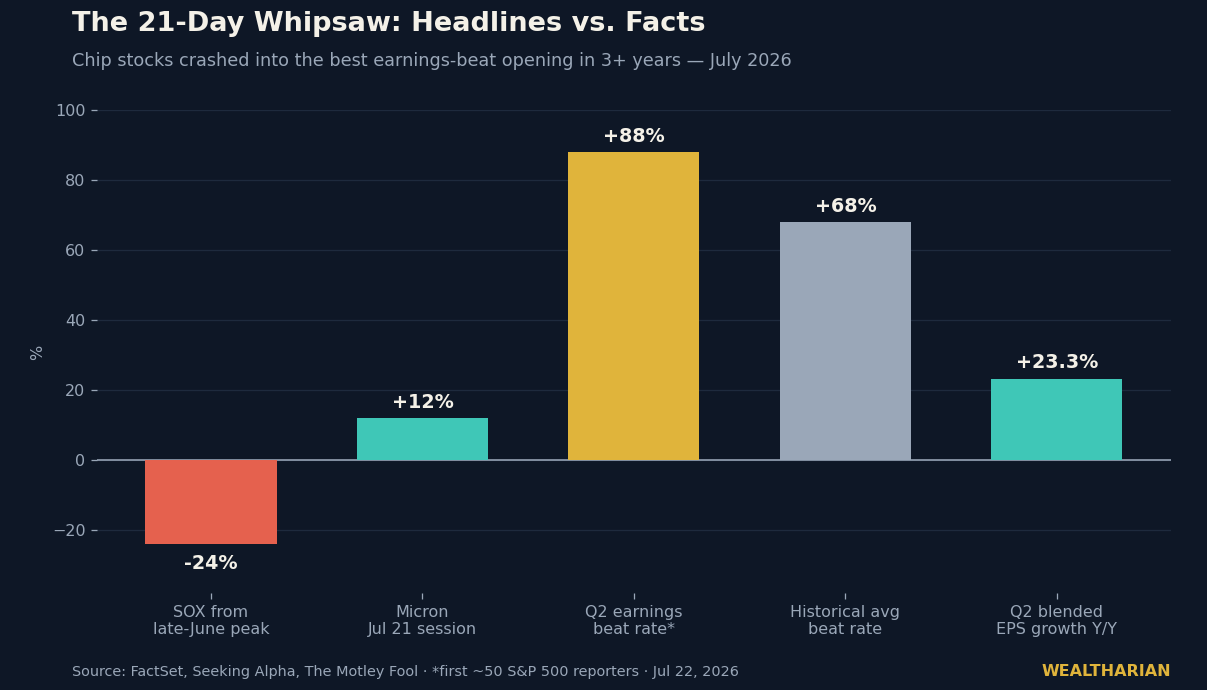
Nothing about the economy fundamentally changed between the panic and the rebound. What changed was that data replaced narrative. That’s the whole story of market timing failure, in one news cycle.
The macro turned on a dime — and nobody rang a bell
Here’s the part worth framing. On July 13, the consensus was “sticky 4%+ inflation, hawkish Fed, possible hike.” Twenty-four hours later, one CPI print rewrote it to “disinflation is back, July hike dead.” Positioning built over weeks unwound in a morning.
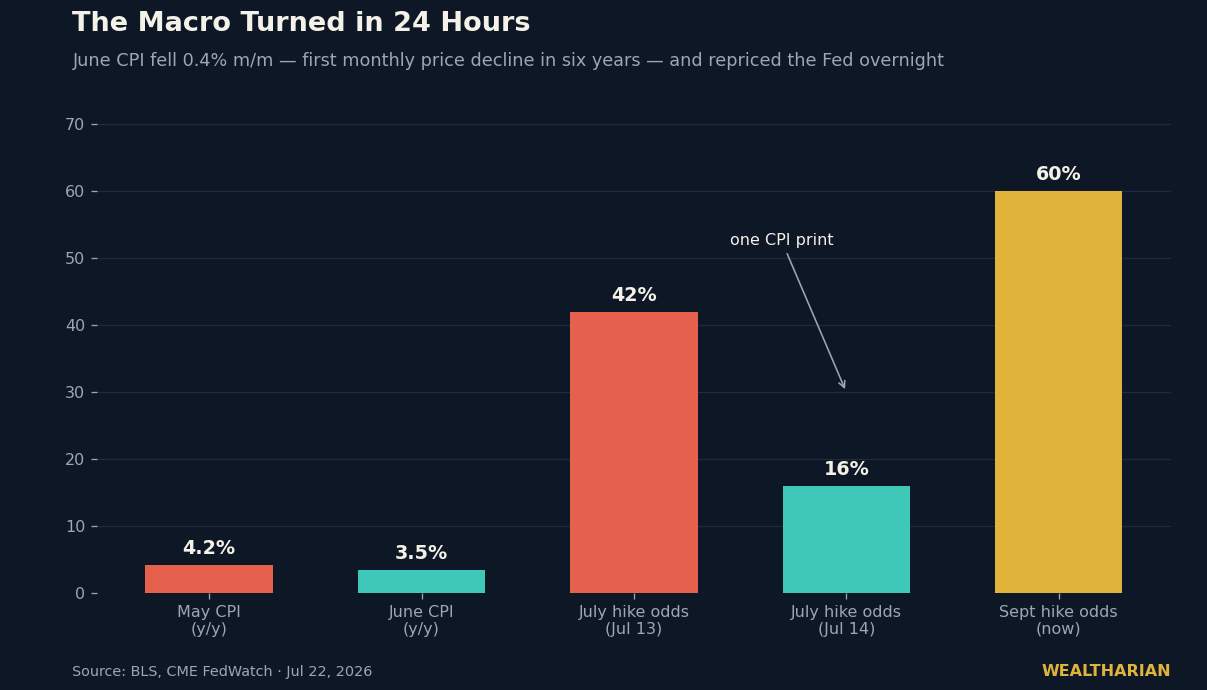
If your plan required you to predict that print, you never had a plan — you had a coin flip with extra steps. Professional forecasters with terminals and models put ~42% odds on an outcome that was repriced to ~16% within a day. The idea that a part-time investor reading headlines can consistently front-run these turns is not a strategy. It’s a story people tell themselves right up until the sequence of July 2026 happens to them.
And to be clear — the macro isn’t “solved.” September still carries roughly 60% odds of a hike, the Warsh Fed keeps repeating that prices are too high, and the same geopolitics that spiked oil in June haven’t gone anywhere. The lesson isn’t that the news turned good. It’s that the news turns fast, in both directions, and faster than you can trade it.
Why market timing fails: the best days hide next to the worst days
The contrarian truth about volatility: it isn’t the fine — it’s the fee. The reason equities pay 7–10% a year over the long run instead of a savings-account yield is precisely that they periodically fall 20% and feel terrible to hold. Whoever refuses to pay the fee doesn’t get the returns.
The mechanics are brutal and well documented. Miss just the ten best days across a couple of decades and you cut your ending wealth roughly in half; the cruel detail is that the majority of those best days occur within two weeks of the worst days — inside exactly the kind of stretch July 2026 just produced. Micron’s 12% session didn’t arrive after calm returned. It arrived while the fear was still in the room. Sellers who wanted to “wait for clarity” were, mathematically, waiting to buy back higher.
We saw the same trap in the great inflation-hedge test: people don’t lose money because assets fail, they lose money because they swap assets at emotional extremes — buying the hedge after it doubled, dumping the compounder in the drawdown.
The system that beats the forecast
You cannot out-predict this market. You can out-structure it. Four rules do most of the work:
1. Automate the buying
A standing order that buys your index allocation every month bought the June top, bought the July bottom, and will buy next month without asking your amygdala for permission. Over decades, that boring average is the whole edge.
2. Rebalance on bands, not feelings
Set target weights and act only when an asset drifts, say, five percentage points away. This converts crashes from emergencies into instructions: the July drawdown becomes “buy chips back to target,” not “should I get out?”
3. Hold a cash runway measured in months, not vibes
Six to twelve months of expenses in cash means no crash can force you to sell at the bottom. Every catastrophic personal investing story starts with a forced sale. Remove the possibility and you remove the catastrophe.
4. Write the rules down before the storm
A one-page investment policy — what you own, why, what you’ll do at −20% — written on a calm day, outperforms any decision made on a red day. If it isn’t written, it isn’t a plan.
None of this is exciting. That’s the point. Excitement is what the sellers of July 6 felt, and what the buyers of July 21 charged them for.
The wealth-builder’s takeaway
Somewhere between the SOX peak and the Micron rebound, a transfer of wealth occurred — from people acting on headlines to people acting on rules. That transfer happens every cycle, in every decade, and it is the quiet engine of long-term compounding. The market doesn’t reward intelligence. It rewards the refusal to interrupt compounding for the sake of feeling safe for a week.
Prices move first; explanations arrive later. Build the machine that doesn’t need explanations.
Want to track your own path to financial independence? The Wealtharian Wealth Tracker lets you monitor your net worth, FU money progress, and investment milestones in one place. Try it free →