
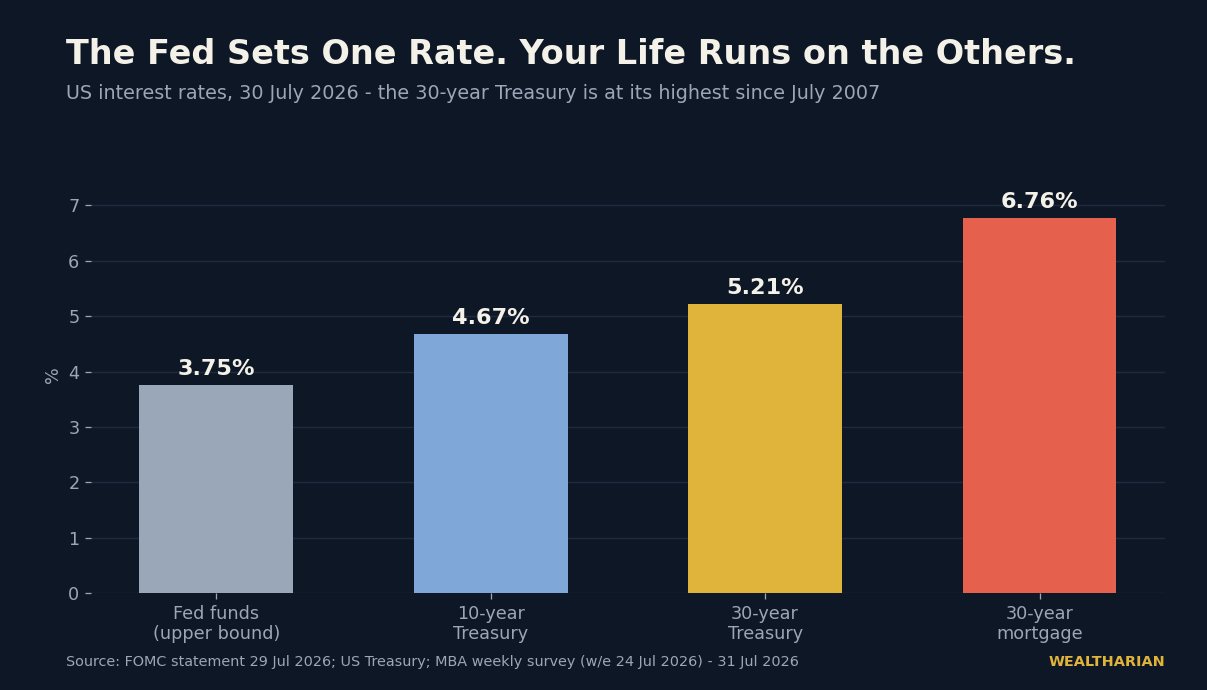
On Wednesday the Federal Reserve did nothing, and the bond market did something. The 30-year Treasury yield closed at 5.21% — the highest level since July 2007 — in the same month American inflation fell to 3.5%. Nearly every headline filed that under “inflation fears.” It is not an inflation story, and mistaking it for one will cost you.
What actually happened on 29 July
The FOMC held the federal funds rate at 3.50–3.75% for the fifth consecutive meeting, on a 9–3 vote — three members wanted a hike. Equities took it badly: the Dow fell 2.2%, or 1,153 points, to 51,594.14, its worst day since April 2025, and the S&P 500 lost 1.5% to 7,316.15.
The more important move happened in bonds. The 10-year Treasury yield rose 7 basis points through 4.67%. The 30-year jumped 10 basis points to 5.21% — a 19-year high. Wall Street has spent two years treating 5% on the long bond as the line that sentiment does not survive. It was crossed on a day the Fed did precisely nothing.
The contrarian read: the 30-year Treasury yield is not an inflation signal
Here is the fact that breaks the consensus narrative. June CPI came in at 3.5% headline, down from 4.2% in May — the first decline in five months and well below the 3.8% forecast. Prices actually fell 0.4% on the month as the energy shock faded. Core inflation is running at 2.6%.
If the long end were pricing an inflation problem, that print should have pulled 30-year yields down. It did the opposite. So the move is coming from somewhere else.
A long yield has two engines: expected inflation, and term premium — the extra compensation investors demand purely for the risk of lending for three decades. The New York Fed’s ACM model put the 10-year term premium at +0.51% in June 2026, after years of deeply negative readings through the QE era. That is not a data point. That is a regime change, and it is being repriced in real time.
Term premium is a price on two things: how much duration the Treasury must sell, and how confident buyers are of being repaid in money that still means something. Neither is decided at an FOMC meeting. We made a version of this argument when oil went above $100 and the bond market shrugged — the long end has stopped reacting to the story everyone is watching and started reacting to the one nobody is.
The detail almost nobody flagged
Look at how the deficit is being financed. Treasury bills — debt maturing in a year or less — now make up roughly 22% of total marketable debt. Bills are the easy sell: money market funds absorb them almost without limit and demand no term premium at all.
Coupons are the hard sell. Notes and bonds carry duration, and duration has to clear against a much smaller pool of pension funds, insurers and foreign reserve managers — a pool that is shrinking relative to supply.
Leaning on bills does not reduce the borrowing. It defers the moment the borrowing has to be placed with someone who genuinely wants 30-year risk. That deferral compounds, and Wednesday was an instalment on it. It is the same instinct we watched Big Tech apply to its AI capital spending: changing when a cost lands never changes whether it lands.
Why 5.21% resets every number in your financial life
The 30-year Treasury is not just a bond that pension funds buy. It is the rate the entire economy is discounted against, and it flows into four places at once:
- Your mortgage. The 30-year fixed averaged 6.76% in the week ending 24 July, tracking the move in Treasuries. A rate the Fed did not set, on the largest liability most households will ever carry.
- Your equities. Every stock is a claim on future cash flows discounted at a rate. When the risk-free 30-year pays 5.21%, the bar every business must clear to justify its multiple rises — permanently, not cyclically.
- Your business or rental property. A project throwing off 7% used to look like a triumph. Against a 5.21% risk-free alternative, it is paying you roughly 1.8 points for illiquidity, tenants, maintenance and execution risk. That is a thinner deal than it feels like.
- Your savings. For the first time in 19 years, a government promises to compound your capital at over 5% for three decades.
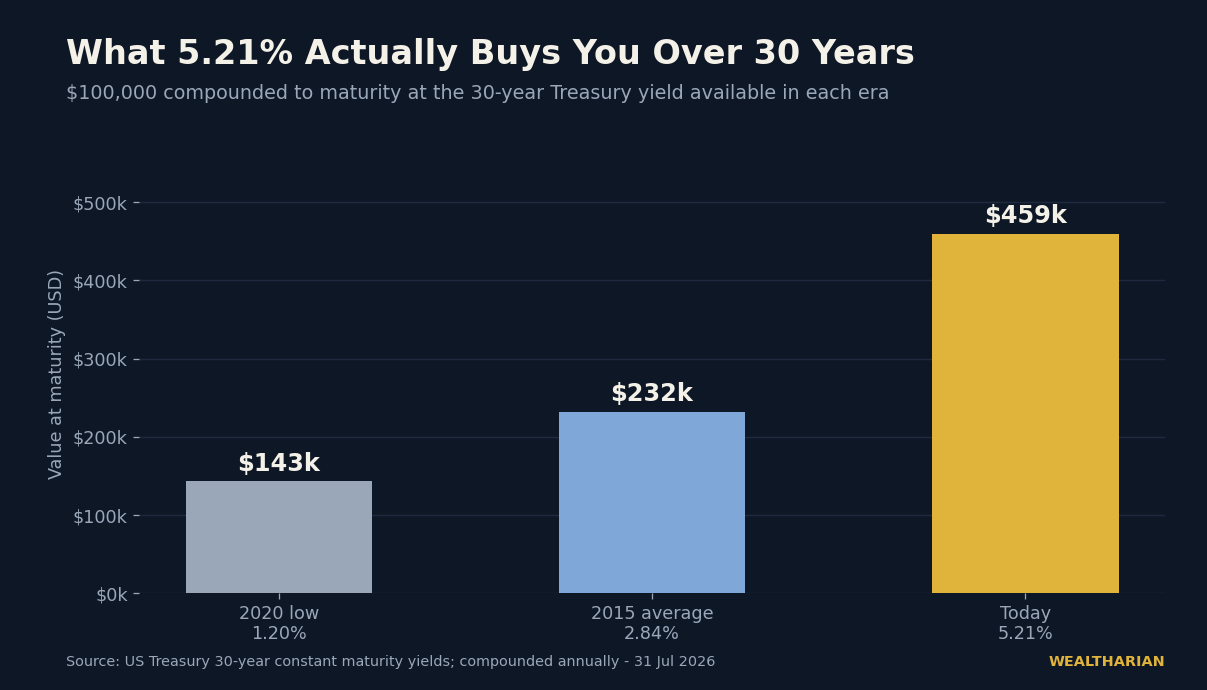
That last chart is the one people underrate. At the 2020 low of 1.20%, $100,000 compounded to roughly $143,000 over 30 years. At today’s 5.21%, the same capital reaches about $459,000 — more than three times as much, for identical risk. An entire generation of investors built its model of risk in a world where the safe asset paid nothing, which made every risk look worth taking. That world has ended. The replacement is not worse. It is simply one that rewards a different behaviour.
How to think about it — four questions, not four tips
- Am I still treating the Fed as the main character? The Fed sets one rate at the very front of the curve. Almost everything that determines your net worth is priced further out. We argued in January that rate cuts were never a wealth plan. Wednesday was the market making the same point louder.
- What is my real hurdle rate? If you cannot articulate why an investment beats 5.21% guaranteed, you do not have a thesis — you have a habit.
- Which side of duration am I on? Long-dated debt you owe has become more expensive. Long-dated assets you can buy have become cheaper. Most people are unknowingly on both sides at once and have never netted them out.
- Does my plan assume the last decade repeats? Cheap money was not the baseline. It was the anomaly. Any plan built on its return is a forecast disguised as a strategy.
The bottom line
Inflation is falling and the cost of long money is rising. Those two facts sit together only if you accept that the bond market has stopped arguing about prices and started arguing about supply and credibility — about how much duration the world is being asked to swallow, and at what price it will swallow it.
The Fed held its rate on Wednesday. The market raised the one that actually matters. If your financial plan only tracks the first number, it is watching the wrong screen.
Want to track your own path to financial independence? The Wealtharian Wealth Tracker lets you monitor your net worth, FU money progress, and investment milestones in one place. Try it free →